12 Essential KPIs for You To Measure Field Service Team Performance
Table of Contents
“If you’re not measuring, you’re just practicing.” – Parsons.
That’s right.
Look, KPIs and metrics matter. Why?
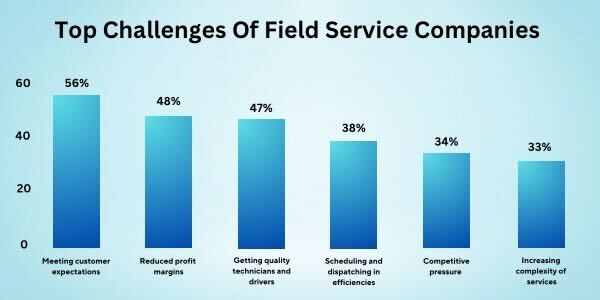
According to the Salesforce State of Service report, 86% of decision-makers at organizations find it difficult to scale their business with a field services team.
That’s why looking through data points is essential, as it tells you more within a few numbers, making you understand whether your business can thrive or is just surviving.
These numbers are nothing but reflect on your field service experts’ operational efficiency, your customers’ satisfaction, and your business performance in terms of costs, growth, and revenue.
But amidst the sea of multiple types of data and uncountable KPIs, finding the right metrics and focusing on numbers first may take you to measure wrong things and overlap your decisions with unworthy choices.
Don’t worry though! This blog is for you to explore a decent number of field service metrics and align your strategic goals to get over frequent field service challenges – that no longer seem impossible.

What Makes A Field Service KPI Good & How Can You Plan for It?
As “Success” means differently for every other organization, measuring field service potential through KPIs can be both subjective and personal. Although those metrics varied, they’ve some common good factors between them while all they showcase
- What you’ve achieved so far
- Where your field service team is lacking or what can be improved still
- Where your filed workers’ productivity stand and how you can initiate productivity calculation
- What’s the current market penetration or in which direction it’s moving forward
- Which state do your customers belong to – frustrated, impressed, or, in a dilemma?
But only a metric-driven strategic mindset is subtle where maximum organizations’ decision-makers get trapped. Instead of asking these questions before finalizing them at all:
- Who’s the recipient of data and what they’re looking for?
- Do you need the data on a daily, weekly, or monthly basis?
- Does that data need to be pulled from a single or multiple sources?
- Does the extracted data cover all endpoints that you jotted down?
Following this step, prioritize open communication with your field service team about your expectations and goals. So neither of you need to go back and forth nor does anyone diving in a stagnant or unexpected situation.
KPIs To Measure Field Service Team Performance
Now, to deploy, manage, and measure your field service teams’ performance and boost their potential, you can take the following field service KPIs into account, which are:
Service Utilization Rate
Utilization = (Service Appointments + Absences + Breaks + Travel Time) / (Overtime Hours + Normal Hours)
Basically, the service utilization rate reflects on your field employees’ timely productivity while also simplifying where they’re spending most of their time – on the job, during breaks and rest, travel, billable tasks, or in transit. The percentage of their actual working hours helps you figure out how you can improve their on-field utilization and prevent quiet quitting.
First-time Fix Rates (FTTR)
First-time fix rate = Number of jobs not requiring a second visit / Total number of jobs
As productivity and efficiency go hands-on-hand, measuring FTTR becomes essential. This metric shows you whether your field service team is competitive enough to troubleshoot your customers’ issues on the first visit. If they’re not, you need to know why they’re falling behind- Is it due to their lack of knowledge or self-doubts or is it their unwillingness?
Average Response Time
Average response time = Total time to respond / Total number of responses
Faster contact resolution happens when you focus on quick responses and thus measuring average response time becomes vital for you to showcase your commitment towards your customers.
However, you can drill down this metric based on your various departments, responsibilities, and service types. And, to build communication faster as well as smoother, schedule, dispatch, and manage field tasks with detailed information so that your field workers don’t need to follow up with you for better clarity.
Mean Time-to-Repair (MTTR)
Mean time-to-completion = Total time taken for repairs / Number of repairs
MTTR is none but the average resolution time that is taken to handle and resolve your customers’ objections as soon as they get reported.
This MTTR is as far as high its lower poor customer experience and less downtime rate. Also, it can be improved by focusing on your field team support, knowledgeable management, training and skill development, AI-driven screening, and so on.
Average Travel Time
Average travel time = Total travel time/Total service calls
Tracking and optimizing how much your field service employees spend traveling each day is absolutely beneficial – be it for controlling extra fuel reimbursement and associated expenses, or to find out obstacles in the route planning process.
You surely do not prefer to waste your money on an employee who loves to spend time on the roads rather than utilize those seconds to find resolutions. Therefore, to keep your eye on field employees’ traveling routes and time, you can get help from the best geo-fence tracking software.
SLA Compliance Rate
SLA compliance rate = Numbers of requests met within SLA / Total numbers of requests
A Service Level Agreement (SLA) is a part of a larger written contract that defines your business standard in terms of quality, availability, and timeline to deliver services and support customers.
As much as you maintain the higher compliance rate, it indicates you and your team are on the right track to provide expected services and other requirements to boost a long-lasting relationship. Also, it prevents you from hopping on out-of-scope work, re-doing services for free, and issuing unnecessary credits or discounts to keep your customer satisfied.
Net Promoter Score
Net promoter score = (Number of Promoter Scores/Total Number of Respondents) – (Number of Detractor Scores/Total Number of Respondents)
You may dive deep to increase your field team performance but without evaluating your customers’ experience and loyalty, it doesn’t make any sense. It may happen that you’ve got a great product but its features are not something your customers are looking for and thus your effort is wasted. Exactly here another important field service KPI, Net Promoter Score reflects on – brand loyalty, customer satisfaction, customer reviews, and recommendations.
For instance, when the customers are asked to rate your product or service, ratings are segmented to know NPS KPI, likely,
- 0-6: They are detractors and highly vulnerable to churning.
- 7-8: They’re called passive and are not necessarily trustworthy or loyal.
- 9-10: They’re promoters who are of course your brand advocates.
Repeat Customer Rate
Repeat customer rate = Repeat customers / Total number of customers
The Repeat Customer Rate (RRR) reflects the proportion of your customers who at least purchased twice from your brand. Usually, tracking this metric is quite difficult though essential as there is no limit for this number.
Basically, your customers purchased from your brand some years back, they may have vanished without notifying you and come again with different enthusiasm for a second purchase, or more than that. However, to calculate this field service metric correctly, only take those customers who actively purchase from you, not those who freeze into the signup or demo booking process.
Customer Retention Rate
Customer retention rate = (End customers – Customers acquired in a certain period) / Customers at the start
A 25% profitability can be achieved if there’s a 5% boost in customer retention – is what Zendesk reports reveal and showcase why evaluating this field service metric should be your utmost priority.
Let me tell you, retaining your existing customers to sell your brand USPs is pretty much easier than approaching and acquiring new ones. Therefore, to maintain a higher CRR, you must know how to allocate your field service resources, channel their effort strategically, and foster brand credibility – all for gaining great brand advocacy and sustainable growth.
Service Profitability
Service profitability = (Revenue – Expense)
It’s important to strike a balance between the expenses that are required to manage your field service operation to keep customer satisfaction and maintain revenue flow to expand your business. That’s why the KPI service profitability comes to show you the reality of where your profit margin stands in the current scenario. Having this data at your disposal takes you to the precision, far less likely to strengthen gross profits and fuel net profits too. To further support this, using a balance sheet template can help you track assets, liabilities, and equity—offering deeper insights into how operational expenses impact overall financial health and long-term sustainability. Implementing automated procurement can streamline purchasing processes, reduce costs, and improve operational efficiency, directly contributing to healthier profit margins.
Revenue Leakage
Revenue leakage = (Actual revenue – Expected revenue)
Revenue leakage is an unnoticed or unintended loss that is similar to losing your customer contract. While leaks can cover both revenue and expenditure, revenue leakage is the result of not-billing or under-billing customers and that’s not completely your field service teams’ fault.
This culprit takes place due to a slower pace that doesn’t match today’s complexity, solely relying on manual billing processes and sometimes even pricing errors. If you find the same obstacles in your way, cut them out with automation as Lystloc does and help your field workers thrive in modernism.
Business Growth Rate
Growth rate = (Current value – Past value) / Past value
As the name suggests, the growth rate is quite easy to calculate and understand the ratio between your business’ current and previous period value. But you need to be very careful while evaluating this area because wrong factors can deceive the result.
For example, the result may show you a year-on-year 10% growth rate and the consistency remains for several months too, which is quite good. But do you know if they come from your old loyal customers or if this growth is covered by your newly acquired customers, segmenting this can give you more precise information about customer-centric growth and so your field teams’ efficiency.
To know your business standpoint, you can consider the same way as the Lystloc growth review does.
The Next Step: Improve the Potential of Your Field Team Performance with Lystloc
Detailed and accurate data fuel KPIs but collecting that information manually isn’t feasible – they’re time killers, at least without field service management software.
Integrating a robust, easy-to-use, cost-effective, online and offline tracker along with a geo-fence-enabled field automation software like Lystloc. It’s not only to demonstrate where your field teams are, how they’re spending their time, and how you can allocate them on urgent tasks but to make them attentive with timely notifications – keep you all on your toes for providing exceptional customer experience.
So, when evaluating field service KPIs is essential, why not keep the updated data to do so by tapping on Lystloc?


